
TL;DR:
- Defining mushroom phenotypes involves detailed measurement and categorization of observable traits linked to molecular identity, enabling reproducible classification across conditions. Modern mycology combines digital imaging, molecular barcoding, and genomics to accurately assess traits like cap size, color, and chemical composition, revealing deeper biological distinctions. Standardized protocols, genetic control, and molecular confirmation are essential for stable, meaningful phenotypic classification and reliable breeding or research outcomes.
Defining mushroom phenotypes means precisely measuring and categorizing observable traits — cap morphology, gill structure, stem geometry, color, yield, and chemical composition — then anchoring those measurements to confirmed molecular identity. Modern mycology treats phenotype not as a single label but as a multidimensional vector of quantifiable data. The field now combines computer vision pipelines, ITS barcoding, and multilocus genomics to produce reproducible classifications that hold up across labs, growing conditions, and generations. Whether you are breeding Lentinula edodes for commercial yield or characterizing a wild Morchella collection, the same integrative logic applies.
What traits characterize mushroom phenotypes and how are they measured?
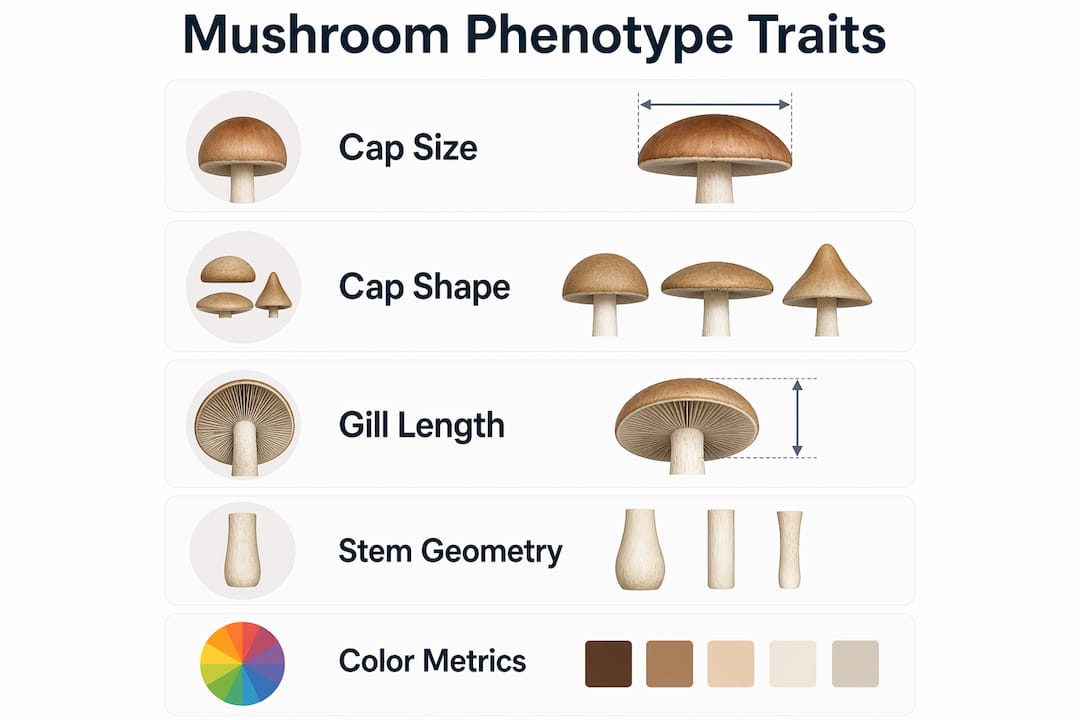
Mushroom phenotype characteristics span six primary categories: cap size and shape, gill length and density, stem geometry, surface color, fresh weight, and chemical composition. Each category requires a distinct measurement protocol to produce data that is comparable across samples and studies.
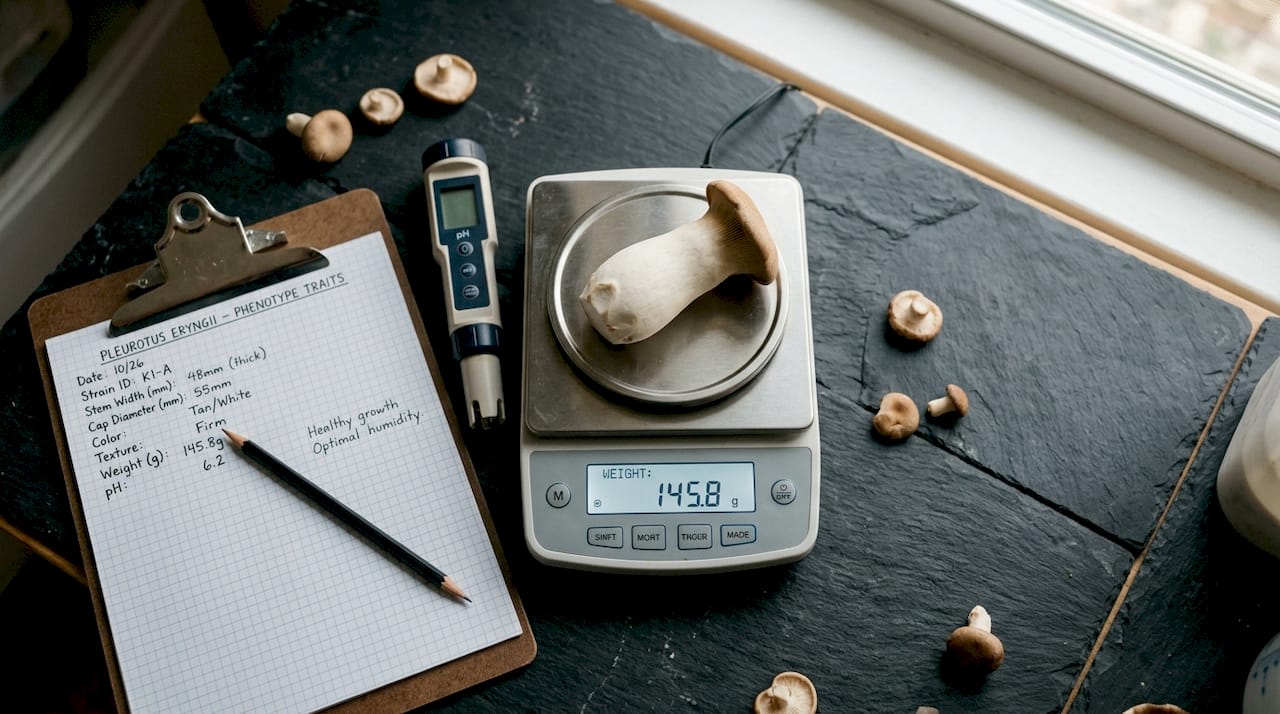
Cap and stem morphology are measured using digital calipers or, increasingly, machine vision systems. A portable RGB and depth imaging system developed for Pleurotus eryngii achieved a size measurement error of just 0.15 ± 0.03 cm, which is tighter than most manual caliper readings. That level of precision matters when you are trying to distinguish phenotypic classes within a single genetic line rather than between species.
Color is one of the most underestimated phenotype dimensions. RGB values alone are lighting-dependent and unreliable across cameras. The Lab color space, which separates luminance from chromatic channels, gives you device-independent readings that transfer between imaging setups. The same Pleurotus eryngii system reached cap color classification accuracy of 91.04%, demonstrating that color can be treated as a quantitative trait rather than a subjective descriptor.
Key morphological traits worth measuring systematically include:
- Cap diameter and height measured at the widest point under fixed lighting
- Gill spacing and length assessed from cross-section images or direct scans
- Stipe length, diameter, and taper ratio using calibrated reference objects
- Surface texture index derived from image segmentation outputs
- Fresh and dry weight recorded at a standardized developmental stage
Pro Tip: Always photograph specimens at the same developmental stage. A cap measured at pin stage versus full maturity produces incomparable data, even within the same genetic line.
Repeated measurements across three or more fruiting cycles reduce noise from environmental fluctuation. Trait stability across cycles is itself a phenotype descriptor worth recording.
How do molecular and genetic methods complement phenotype definitions?
Morphology alone misleads. Morphological convergence across unrelated fungal lineages means two mushrooms can look nearly identical while being genetically distant, and two strains of the same species can look different while sharing 99% of their genome. Molecular methods resolve that ambiguity.
The internal transcribed spacer region, ITS, is the universal fungal barcode and the starting point for any species-level identity confirmation. ITS-based high-resolution melting assays, such as Bar-HRM applied to Morchella species, can discriminate four melting patterns corresponding to three taxonomic species from a single PCR reaction. That speed matters when you are processing large collections.
ITS has real limits, though. It cannot resolve closely related species in genera like Galerina or Cortinarius, and it tells you nothing about trait-expression biology. The table below compares the major molecular approaches used in mushroom phenotype work:
| Method | Strength | Limitation |
|---|---|---|
| ITS barcoding | Fast, universal, database-rich | Fails at species boundaries in complex genera |
| Multilocus sequencing | Better resolution for cryptic species | Requires multiple primer sets and more time |
| Whole-genome sequencing | Full genotype-to-phenotype mapping | Cost and bioinformatics overhead |
| Metabolomics / chemotyping | Captures chemical phenotype directly | Sensitive to growth conditions |
| Transcriptomics | Links gene expression to phenotype class | Snapshot only; condition-dependent |
Chemotype analysis adds a layer that neither morphology nor ITS can provide. A study of 53 Polyporus umbellatus samples from across China found that metabolite profiles cluster by lineage, not by morphological classification. That finding has direct implications for medicinal strain selection: the chemical phenotype you want may not correlate with the shape you expect.
Congenic strain construction takes genetic control one step further. Researchers working with oyster mushroom used ten backcross generations to produce strain PC9.15, which shares 99% genome similarity with the parent except at the matA and matB mating-type loci. That design lets you attribute phenotypic differences to specific loci rather than background variation, which is the gold standard for any trait-mapping experiment.
Pro Tip: Treat ITS as your species passport and multilocus or genome data as your trait-mapping tool. Using ITS alone to explain phenotypic variation is like using a zip code to explain a person’s behavior.
What are best practices for digital phenotyping and data standardization?
Reproducibility in digital phenotyping collapses without locked protocols. Standardized image preprocessing including background normalization, fixed resizing to 640×640 pixels, and color channel correction must be documented and applied identically across all imaging sessions. Changing any one parameter mid-study invalidates cross-batch comparisons.
The workflow for a reliable digital phenotyping pipeline follows a clear sequence:
- Fix imaging geometry. Set lens distance, angle, and focal length before the first sample and do not adjust. A shiitake stipe phenotyping study fixed the lens at 270 mm distance with 5488×3672 pixel resolution and held those parameters across the entire dataset.
- Place calibration objects in every frame. Physical reference objects with known dimensions, such as coins measuring 25.00 mm, 20.50 mm, or 19.00 mm, or a 15 cm scale bar, allow pixel-to-millimeter conversion without relying on camera metadata alone.
- Apply background segmentation. Models like Aspp-VGGUnet or YOLOv8 isolate the specimen from the background before any measurement is taken. This step eliminates shadow and substrate contamination from color and shape readings.
- Run color normalization. Convert RGB outputs to Lab color space and apply illumination correction before recording color trait values.
- Validate model performance. Report mIoU, mean pixel accuracy (mPA), precision, and recall for every segmentation model used. A system without published performance metrics cannot be compared to other studies.
The efficiency gains from automation are substantial. Automated measurement of Pleurotus eryngii phenotypes takes approximately 2 seconds per specimen versus 76 seconds for manual caliper measurement. Across a breeding trial with thousands of specimens, that difference determines whether high-throughput phenotyping is feasible at all.
The following table summarizes key performance benchmarks from published digital phenotyping systems:
| System | Crop | mIoU | mPA | Measurement error |
|---|---|---|---|---|
| RGB+RGB-D pipeline | Pleurotus eryngii | 96.47% | 98.53% | 0.15 ± 0.03 cm |
| Machine vision stipe system | Lentinula edodes | Not reported | Not reported | Sub-mm with calibration |
| YOLOv8/YOLOv11 comparison | Multiple species | Reported per model | Reported per model | Preprocessing-dependent |
How is phenotype stability assessed and phenotype categories validated?
A phenotype is only meaningful if it is stable across genetic backgrounds and reproducible across growing cycles. Validation requires both experimental design and statistical confirmation.
Congenic strain construction, as described above for oyster mushroom, is the most rigorous approach for attributing a phenotype to a specific locus. Without controlling the genetic background, you cannot distinguish a locus effect from a background effect. The 99% genome similarity achieved after ten backcross generations in oyster mushroom sets a practical benchmark for what “controlled background” means in fungal genetics.
Transcriptomics provides a second validation layer, particularly for malformation or pathology phenotypes. A study of Lentinula edodes malformation phenotypes identified four distinct phenotype classes with differentially expressed gene counts ranging from 61 to 288 genes per class. That range shows that phenotype categories differ not just visually but at the level of gene expression, which confirms their biological reality rather than treating them as arbitrary visual groupings.
Challenges worth anticipating in phenotype validation include:
- Morphological convergence. Two unrelated species can produce nearly identical fruiting bodies. Molecular confirmation is non-negotiable before assigning phenotype data to a species.
- Cryptic species. Within a morphologically uniform collection, ITS or multilocus sequencing may reveal multiple genetically distinct lineages, each with its own phenotype distribution.
- Environmental plasticity. Cap diameter, color, and stem length all respond to CO2, humidity, and light. Phenotype categories must be validated under controlled conditions before being applied to field-collected material.
- Batch effects in imaging. Camera sensor drift, bulb aging, and seasonal light variation introduce systematic errors that calibration objects and preprocessing protocols are designed to catch.
Statistical validation of phenotype categories uses quantitative image signatures, clustering algorithms, and linear discriminant analysis to confirm that proposed categories are separable in trait space. A category that overlaps extensively with another in multivariate trait space is not a valid phenotype class regardless of how distinct it looks to the human eye.
Key takeaways
Defining mushroom phenotypes requires combining quantitative morphological measurement, standardized digital imaging, molecular identity confirmation, and controlled genetic backgrounds to produce classifications that are reproducible and biologically meaningful.
| Point | Details |
|---|---|
| Phenotype as measurement vector | Record cap, gill, stem, color, weight, and chemistry together rather than relying on any single trait. |
| Molecular anchoring is mandatory | Use ITS barcoding as a species passport before attributing trait data to any named taxon. |
| Calibration prevents silent errors | Place physical reference objects in every image frame to convert pixels to real-world dimensions accurately. |
| Congenic strains isolate locus effects | Ten or more backcross generations are needed to attribute phenotypic differences to specific genetic loci. |
| Preprocessing must be locked | Fix resizing, background normalization, and color correction protocols before data collection and never change them mid-study. |
Why single-trait thinking still dominates, and why that needs to change
I have spent enough time in mycology conversations, both at the bench and behind the counter at Theelevatedremedies, to notice a persistent pattern. Most people, including many researchers, still reach for a single trait when they describe a mushroom phenotype. Cap color. Spore print. Stem thickness. One number, one label, done.
That approach works well enough for casual identification. It fails completely when you are trying to breed for a specific chemical profile, validate a medicinal strain, or confirm that two batches of dried mushrooms came from the same genetic line. The research is unambiguous on this point: chemotype clusters by lineage, not by shape, and transcriptomic profiles separate phenotype classes that look identical under a hand lens.
The practical implication is that anyone sourcing mushrooms for wellness applications, whether microdosing capsules or functional extracts, should be asking suppliers about molecular confirmation and chemical profiling, not just visual inspection. Understanding what makes a strain potent starts with understanding what traits are actually being measured and how.
The automation side of this field is moving faster than most people realize. A 2-second automated measurement versus 76 seconds by hand is not just a convenience. It is the difference between phenotyping 100 specimens per day and phenotyping 10,000. That throughput changes what questions you can ask. Breeding programs that were impractical five years ago are now feasible with off-the-shelf imaging hardware and open-source segmentation models.
My honest recommendation: treat every phenotype definition as a protocol document, not a description. Write down your imaging geometry, your calibration objects, your preprocessing steps, and your molecular confirmation method. If you cannot hand that document to someone else and have them reproduce your phenotype categories, the categories are not yet defined. They are just observed.
— Juiced
Explore verified mushroom phenotypes at Theelevatedremedies
Theelevatedremedies sources mushroom products with consistency and quality in mind, which means the phenotype characteristics of what you are buying actually matter to us. From dried magic mushrooms to microdosing capsules and mushroom chocolates, every product in our Ann Arbor dispensary is selected for reliable, repeatable traits rather than just appearance.

If you want to go deeper on a specific species, our Amanita muscaria product page covers the phenotypic traits and effects of one of mycology’s most studied and visually distinctive mushrooms. You can also read our breakdown of functional mushroom definitions to understand how trait-based classification connects to wellness applications. Stop by 1123 Broadway St in Ann Arbor or browse online to see what we carry.
FAQ
What is a mushroom phenotype?
A mushroom phenotype is the complete set of measurable observable traits expressed by a fungal organism, including cap shape, gill structure, stem geometry, color, yield, and chemical composition. Modern definitions treat phenotype as a multidimensional measurement vector rather than a single descriptive label.
Why is ITS barcoding used in mushroom phenotype work?
ITS is the universal fungal barcode and confirms species identity before trait data is assigned to a taxon. Without molecular confirmation, morphologically similar but genetically distinct species can be grouped together, producing meaningless phenotype categories.
How do you measure mushroom color as a phenotype trait?
Color is measured in the Lab color space rather than RGB to produce device-independent values that transfer across imaging setups. Systems like the Pleurotus eryngii RGB and depth imaging pipeline have achieved cap color classification accuracy of 91.04% using this approach.
What makes a mushroom phenotype stable across generations?
Phenotype stability requires a controlled genetic background, typically produced through repeated backcrossing to create congenic strains. Oyster mushroom research used ten backcross generations to achieve 99% genome similarity, isolating phenotypic differences to specific mating-type loci.
Can two mushrooms look the same but have different phenotypes?
Yes. Morphological convergence means unrelated species can produce nearly identical fruiting bodies, while chemotype and transcriptomic data reveal distinct phenotype classes. Polyporus umbellatus research confirmed that chemical phenotype clusters by genetic lineage, not by visual morphology.